
Today, 14th November, is GIS Day and to mark the occasion, Animal and Plant Health Agency staff explain the role that GIS plays in safeguarding animal and plant health in the United Kingdom.
What is GIS?
GIS can refer to both ‘Geographic Information Science’, as a scientific discipline, or ‘Geographic Information Systems’, and the tools and software that put Geographic Information Science into practice. GIS is all about considering where “things” are located and how they move and interact.
In the context of APHA this involves enhancing existing data sources with a geographic dimension to observe and understand patterns. This enables improved knowledge of issues such as the distribution of livestock and the spread of invasive species.
Why does it matter?
One of the most familiar aspects of GIS is creating maps that are clear and easy to understand. An effective map can give its user a wealth of information that would be hidden in other forms. Providing maps with the correct level of detail ensures APHA field staff know where they need to be and that those directing operations have a clear operational picture.
But GIS is about far more than maps, its true foundation is data. Specifically, data that can be enriched and enhanced with geographic processing, ensuring the geographic dimension is appropriately understood to widen the agency’s knowledge of the world around us.
At APHA, GIS is used in many ways by a relatively small team of Geographic Information (GI) professionals spread across the agency, below are just a few examples of what we do.
GIS in Service Delivery
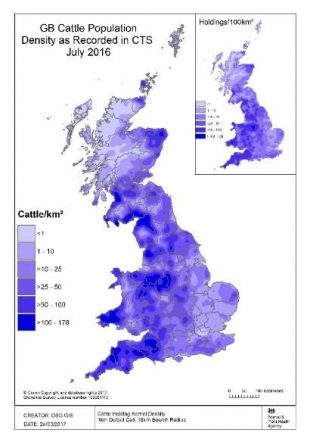
In Service Delivery, geographic work is distributed across teams in England, Scotland and Wales who work with field delivery teams, customer services, contingency planning, policy teams in Defra and the Welsh government and Scottish governments. The primary emphasis for the GI teams is on livestock disease control for endemic diseases, such as bovine tuberculosis (bTB), and exotic diseases, including foot and mouth (FMD), avian influenza (AI), swine fever (Classical and African) and bluetongue.
The initial focus for both endemic and exotic diseases is the location of the livestock at affected premises and the presence of other susceptible species in the zones around the infected premises. Mapping of these locations is carried out to support veterinary investigations and identify nearby herds/flocks for disease testing, to prevent further disease spread.
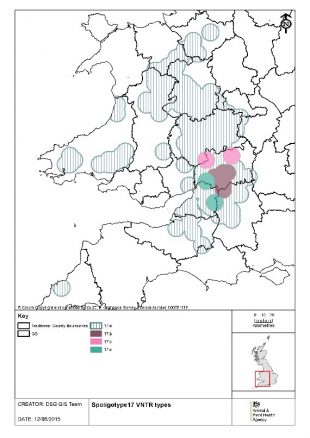
GIS in epidemiology
Epidemiology is the study of how and why disease occurs in a population. GIS plays an important role in science and research projects at APHA as the spread of disease has an important geographical element to it. GIS techniques have been used to calculate bTB “home ranges”. This is the geographic area where a given strain of bTB has persisted across a five- year rolling window.
GIS and geographic data are also used to optimise scientific models, enhancing the understanding of disease spread and how it interacts with the surrounding landscape and environmental factors.
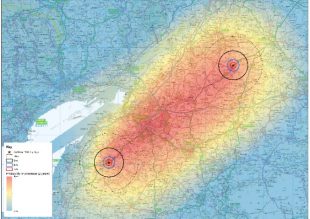
GIS techniques are used to analyse animal movements to help explain disease spread and patterns of movement activity, while advanced road network models have been used to identify epidemiological trends in veterinary submissions about livestock health. You may also be interested in reading about the work of the Livestock Demographic Data Groups on the distribution of the animal populations and holdings across Great Britain.
GIS in Wildlife
Unlike other areas of APHA, work focussed on wildlife species is less directly constrained by human influences, which introduces some additional challenges around mapping and monitoring species interactions.
One example is the mapping and monitoring of Asian hornet (Vespa velutina). As a threat to our native honey bees and pollinators, it is considered to be a high priority species, and we are working to reduce its spread in the UK.
Geographic information is very much embedded in our outbreak response, and whenever we receive a positive report, the first questions we are asked are all geographic - where is the sighting, where are the nearest apiaries, where should we start looking?
In almost all wildlife disease incidents, geographic data about the wider landscape, combined with data on species ecology allows us to model the potential spread of the species or infection - helping us to prioritise future surveillance plans and target our communications with bee-keepers, landowners and other key stakeholders.
Bringing it together
GIS forms an often unnoticed but core part of what we do at APHA. GIS helps us to visualise and communicate important information, as well as add geographic enhancements to data we hold. Better data and understanding of geographic interactions is crucial to effective delivery of APHA services to the public.
You can find out more about GIS Day by visiting the GIS Day website
Recent Comments